HVAC Revenue Potential Calculator

Find out how much revenue you're leaving on the table

Enter your numbers and get three honest revenue scenarios, a visibility vs. conversion diagnosis, and a 5-pillar site health score — all calculated against real HVAC benchmarks. Under 3 minutes.

Free Under 3 minutes For HVAC Owners & GMs Live Semrush + PageSpeed data
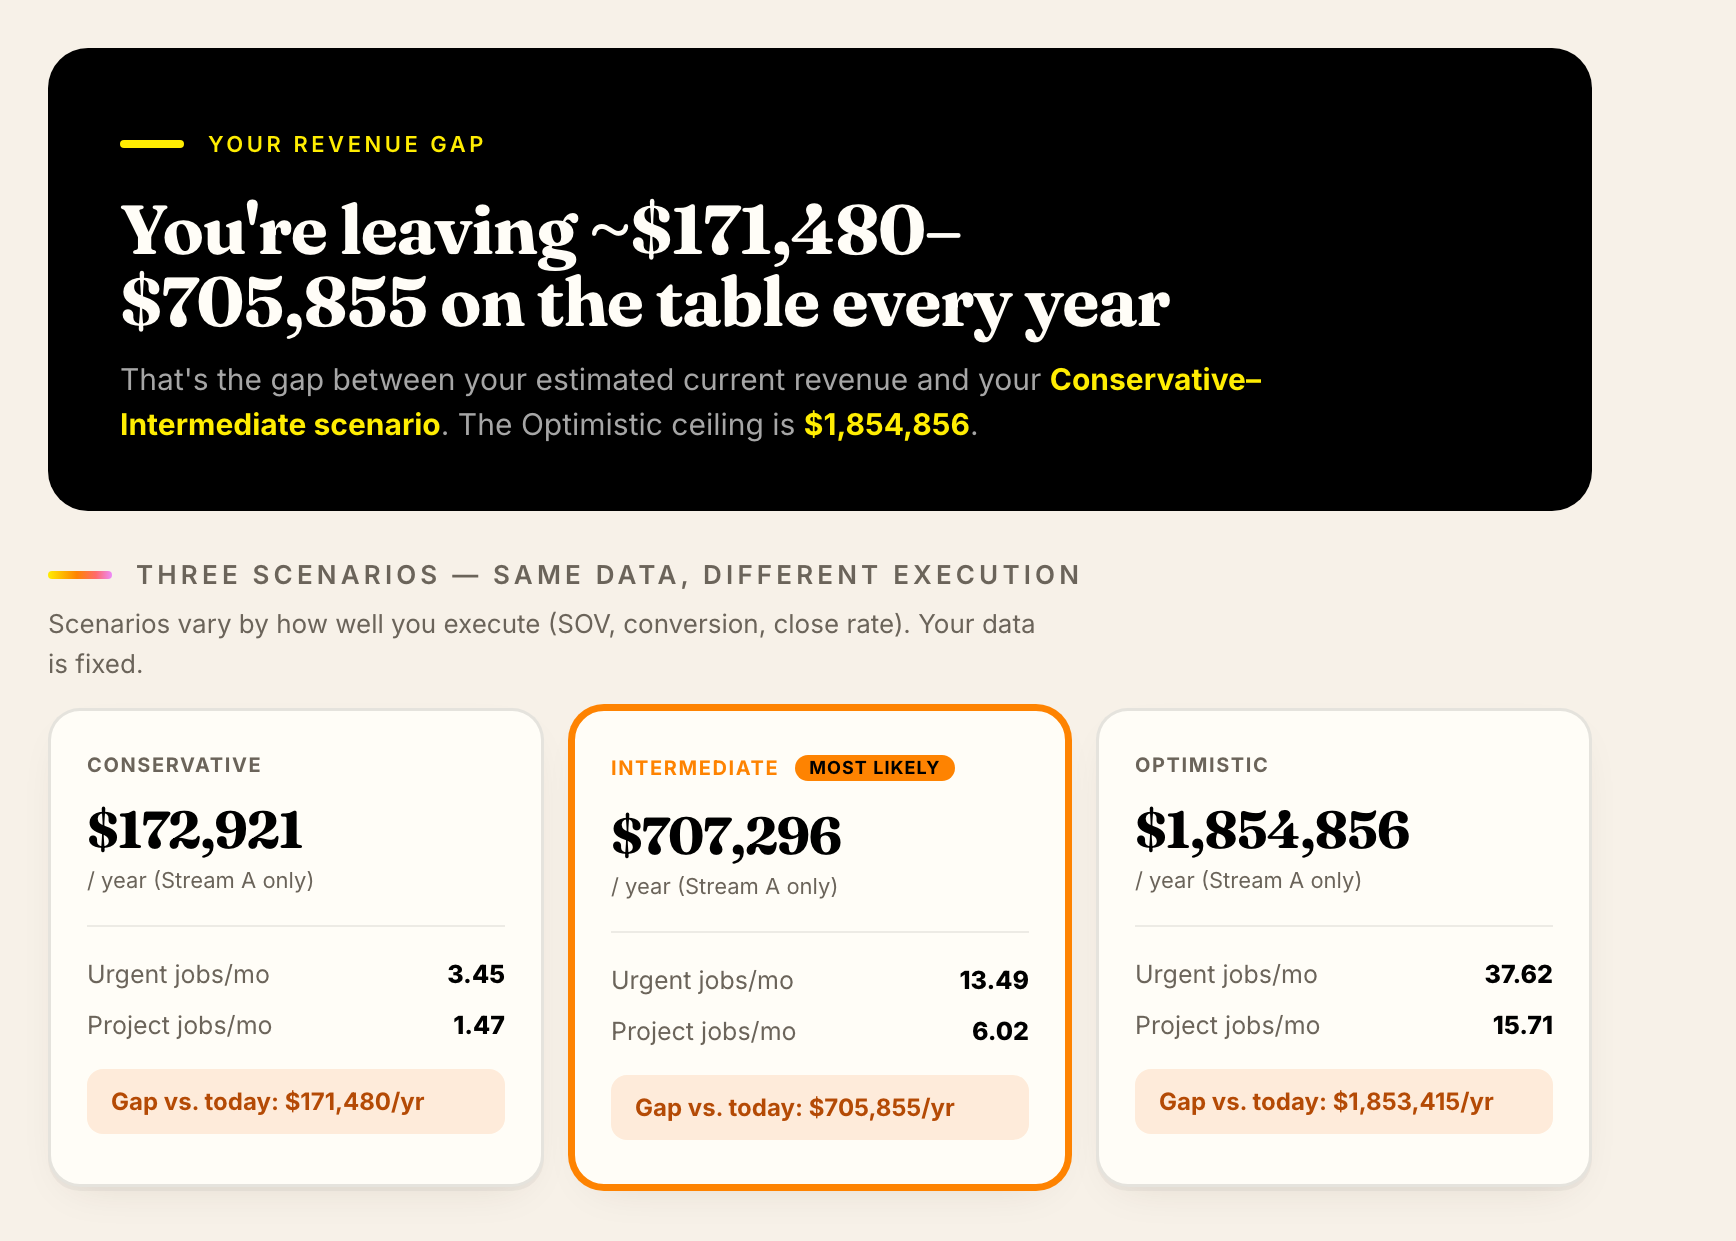
What you'll get

This is exactly what your report looks like

Real numbers, calculated live from your inputs + Semrush visibility + PageSpeed data. The sample below uses a fictional HVAC company in Phoenix, AZ.

Your revenue gap

$240,000 – $420,000 / year

That's the gap between your estimated current revenue and your Conservative–Intermediate scenario. The Optimistic ceiling is $610,000.  (Example only)

Conservative
$380,000
/ year (Stream A only)
Urgent jobs/mo24
Project jobs/mo4
Intermediate Most likely
$560,000
/ year (Stream A only)
Urgent jobs/mo38
Project jobs/mo6
Optimistic
$750,000
/ year (Stream A only)
Urgent jobs/mo52
Project jobs/mo8
Primary gap — fix this first — Visibility gap
$198,000
Revenue lost because search engines and homeowners can't find you. Fix: SEO, paid search, LSA.
Secondary gap — Conversion gap
$84,000
Revenue lost because visitors who do find you don't call. Fix: website CRO, speed, trust signals.
Speed
54
Trust
72
Calls-to-action
38
Local SEO
88
Mobile UX
61

This is a sample — your real numbers are calculated live from Semrush + PageSpeed data for your actual website and service area. Results take 10–25 seconds.

How it works

Three steps.
One honest diagnosis.

Step 01

Enter your numbers

Your website URL, service area, ticket averages, and a few quick operating questions. No guesswork required — estimates are fine.

Step 02

We pull live data

We run your domain through Semrush (organic visibility + share of voice) and Google PageSpeed (5-pillar site health) in real time. This is what makes your results specific to you.

Step 03

Get 3 honest scenarios + a diagnosis

Conservative, Intermediate, and Optimistic revenue — plus a clear answer: is your gap a visibility problem or a conversion problem? That distinction drives which lever to pull first.

Your business data

Calculate your revenue potential

Use estimates if you don't have exact figures. Your URL and service area trigger the live Semrush + PageSpeed pulls.

Triggers the Semrush visibility pull and PageSpeed 5-pillar score.
Used to estimate local search volume share vs. national data.
Ticket averages
$
Service call, repair, tune-up. Industry range: $150–$450 (Angi/Housecall Pro 2026).
$
System replacement or install. Industry range: $8,000–$14,100 (Modernize 56K projects, 2026).
Paid advertising (optional — improves diagnosis)
MIT / InsideSales 2007: responding in under 5 min = 21x more likely to qualify a lead vs. 30 min.
What the tool does with your URL: it pulls your Semrush domain visibility (organic traffic + share of voice) and runs a Google PageSpeed score (5 pillars) in real time. These become inputs to the revenue model — they're not stored separately.

Pulling live data and running your revenue model...
Semrush + PageSpeed + US Census · typically 10–25 seconds